

Property taxes are always a painful subject. So painful that when your partner comes in late at night after a 60-minute commute, you may not want to open with, “DoorDash is delivering our two Philadelphia sushi rolls, and we have to pay $6,500 by September 1.” Regardless, with courage and valor, we must face the possibility that some residents are unfairly paying more tax to support other residents.
Your property tax is determined by the assessed value of your property times the tax rate. Both of those components are determined by the state and local governments. The state’s assessor’s office “decides” what your property is worth, and the county applies a percentage to that assessment. Add and subtract a few adjustments, and you arrive at the amount due.
I’ve always wondered about the assessed value portion of the property tax. Is it close to the value at which we sell our houses? Does it fairly spread the tax burden?
Using a methodology that would make an overworked post-doc at the NIH faint with disbelief, I did a comparison between our properties’ assessed values and the estimated sales price on Zillow. Zillow’s estimates are never meant to be an accurate indication of a closing sale’s price, and they are almost always higher than the assessed value. Nevertheless, the “Zestimates” of property values are highly correlated with the state’s assessments at ρ = 0.967, so the two series can be compared.
Suppose we have two homeowners as in the following table.
| Homeowner | Zestimate | Assessment | Tax rate | Property tax |
| A | 750,000 | 500,000 | 1.04% | $5,200 |
| B | 900,000 | 500,000 | 1.04% | $5,200 |
According to Zillow’s estimate, Homeowner B is living in a more valuable asset but is paying the same property tax as Homeowner A. In this scenario, Homeowner A is paying more of the tax burden than Homeowner B, and arguably providing services to Homeowner B.
To what extent does this disparity play out in our assessments? Are some populations in the county paying unnecessarily more to the benefit of others? Here are some insights. (All the percentages mentioned below are averages from the sample population.)
Disparity by ZIP code
Below is a sampling of Zillow-Assessment differentials by ZIP code. (Some of these ZIP code boundaries extend beyond the MoCo boundary, but the tax bills I examined are all within MoCo.) Lighter shades indicate a higher difference between Zillow and the assessment (meaning those residents are assessed much less than what their property is worth), and darker shades indicate a smaller difference (those residents are assessed somewhat less than what their property is worth). Generally, downcounty residents are assessed at values closer to what they can sell their properties for, and upcounty residents are assessed at values much lower than what their properties sell for. A possible conclusion is that downcounty residents are unfairly burdened.
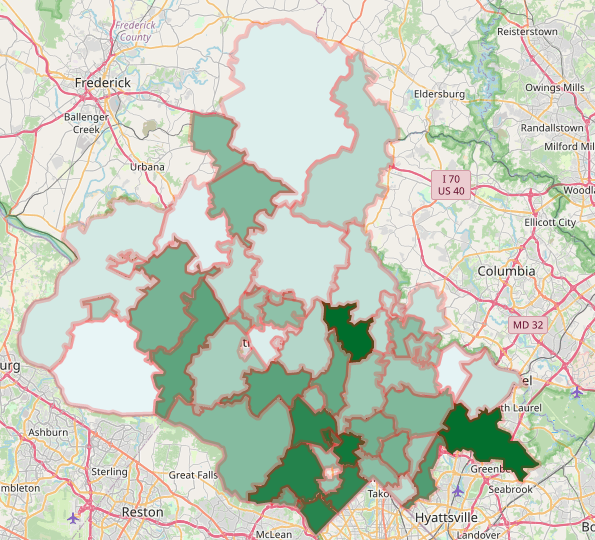
You can view an interactive version of this map at https://michaelbellcsm.github.io/assessments_by_zip_code.html.
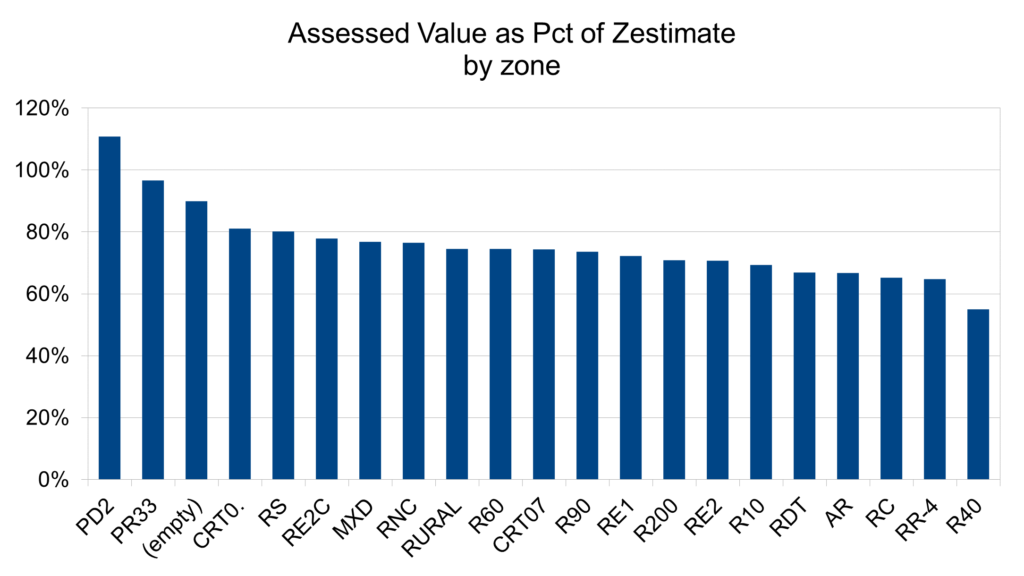
Disparity by zoning
A more striking disparity is by the type of zoning for each property. Lots zoned PD2 (a miscellaneous classification) are assessed at over 100% of their estimated sales value. Lots zoned R-40 (typically a single-family dwelling on 4,000 sq. ft.) are assessed at 55% below their estimated sales value. Again, it is possible that the first group is unfairly burdened to the benefit of the second group.
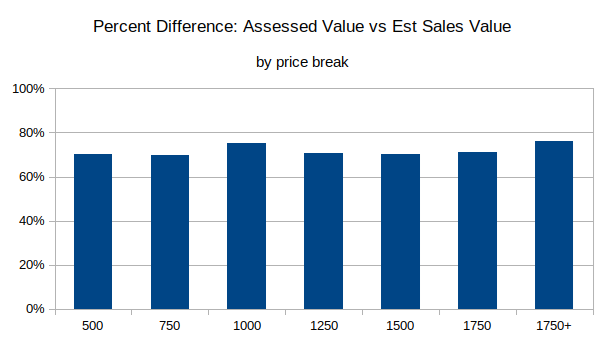
Disparity by price point
There is some disparity when discriminating by price point. Homes with estimated sales value less than $500,000 are assessed at 70% of that value, and homes over $1.75 million are assessed at 76% of that value.
Conclusion
If you live in the 20815, 20816, or 20895 ZIP codes, I wouldn’t use this post as proof that your property is being assessed unfairly high. As admitted, my methodology is not rigorous enough to make a solid case for discriminatory assessments. Furthermore, upcounty residents will assert quite correctly that they receive fewer county services than those residence living snugly below the Beltway. Nevertheless, given these preliminary results, it would be worthwhile to conduct a thorough study to test the hypothesis that some areas or demographics are being unfairly assessed compared to others. If you are interested in commissioning such a study, contact me at mbell@cleanslatemoco.com